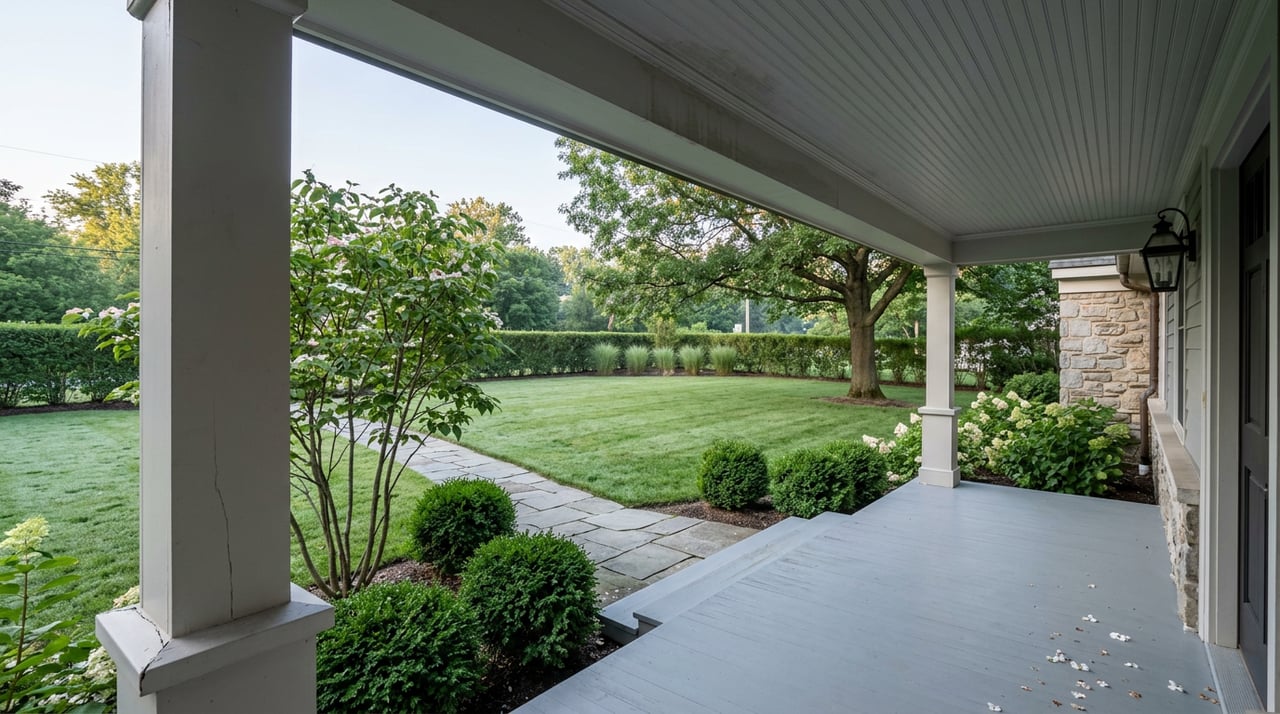
Picture two similarly priced listings on Cincinnati's east side, both a short walk from a coffee shop and a park. One sits in Mount Lookout, where homes in that price range tend to draw multiple offers within days and close above ask. The other sits in the East End, where a comparable listing tends to take roughly five weeks and close below list. Same price band, same general part of town, a completely different negotiation.
That gap is the thing worth understanding before you write an offer or set a list price anywhere on Cincinnati's east side. The number on the sign tells you almost nothing about how the deal will actually go. What tells you more is the pocket the house sits in, because pace and leverage vary block by block in ways a single city-wide median can't capture.
The Number That Doesn't Travel
Citywide, Cincinnati's market has been behaving in a fairly consistent way through 2026. Over the three months ending July 2026, the median sale price landed at $300,000, up 5.2 percent from the same period a year earlier, with homes typically selling in about 49 days and drawing two offers on average, according to Redfin's metro tracking. The Federal Reserve's own housing data pegs the metro's median days on market at 42 in August 2026. The REALTOR Alliance of Greater Cincinnati reported a similar median sold price of $300,000 back in January 2026, alongside a 32.1 percent jump in active inventory year over year and a median of just 15 days on market for that month specifically.
Those are useful numbers for understanding the region as a whole. They are close to useless for predicting what happens on any single street east of downtown, because the neighborhoods that make up that average are pulling in opposite directions. A house that behaves like the metro average doesn't really exist on the east side. It behaves like Mount Lookout, or it behaves like the East End, and those are two different worlds.
How Ten Pockets Diverge
A review of the trailing twelve months of closed MLS sales inside Cincinnati's city limits shows just how wide that spread runs among the east side's best-known neighborhoods.
| Neighborhood | Average sale price | What the data shows |
|---|---|---|
| East End | $779K | Averages about five weeks to sell, often closes below list |
| Mount Lookout | $728K | Highest median in the ranking at $600K; sells in days, often above asking |
| Hyde Park | $722K | One of three squares, with Mount Lookout and Oakley, built for walk-to-dinner convenience |
| Mount Adams | $717K | Fourth-highest average sale price on the east side |
| Oakley | $547K | Sells in days, often above asking; anchored by Oakley Square on Madison Road |
| Columbia-Tusculum | $522K | Mid-pack by average price, between Oakley and East Walnut Hills |
| East Walnut Hills | $501K | $125K gap between average and median signals a stratified market |
| North Avondale | $477K | Rated the best relative value in the ranking |
| Clifton | $374K | Zillow's estimate runs $186K above the actual median, the widest disconnect in the data |
| Pleasant Ridge | $358K | Sells in days, often above asking; centered on Montgomery Road |
Notice that East End carries the highest average price on this list and still takes the longest to sell, while Mount Lookout and Oakley post lower averages than the East End and move in days. Price rank and pace rank are not the same ranking. Mount Lookout also holds the highest median sale price on the east side at $600,000 even though it lands second by average, which tells you the East End's average is being pulled upward by a handful of large riverfront sales rather than reflecting what a typical buyer there pays.
The Walkable Squares That Set the Pace
Mount Lookout and Oakley are the two east-side neighborhoods the data calls out by name as fast markets, the kind where homes sell in days and above asking. Both share a physical trait with Hyde Park: you can park once and walk to dinner. Oakley Square on Madison Road is built that way, with restaurants, bars, and shops within a few blocks of each other, and Hyde Park Square follows the same layout. That density means a buyer touring one listing is also touring the neighborhood's whole evening routine.
The Wasson Way trail adds another layer of connective tissue specifically between Hyde Park and Oakley. The rails-to-trails corridor links the two neighborhoods for pedestrians and cyclists, and homes near the trail on either edge tend to benefit from easier access between them, which keeps demand flowing between the two markets rather than concentrating in just one.
Yet Hyde Park and Oakley don't behave identically, and the ownership mix underneath each one helps explain why. In Hyde Park's 45208 zip code, owners make up roughly 62 percent of households, and the median household income runs around $137,600. In Oakley's 45209, renters make up roughly 61 percent of households. A neighborhood with a higher owner share tends to produce fewer listings at any given time because fewer households are moving, and when one does come up it gets fought over harder. A renter-heavy neighborhood produces more turnover and a wider range of housing stock, from starter condos to renovated bungalows, which helps explain why Oakley can carry a lower average price than Hyde Park while still showing up in the data as one of the fastest-moving markets on the list.
If you are comparing these two on paper, the price gap alone might suggest Oakley is the value play and Hyde Park is the reach. What the ownership data actually tells you is that you are comparing a market with less inventory churn to one with more, and that difference shows up in how many options you'll actually get to see before you have to compete for one.
Where the Same Name Hides Two Markets
Clifton and East Walnut Hills complicate the picture further, because within each of these neighborhoods sit two housing markets wearing one name.
In Clifton, grand Victorian mansions from the university's early boom years sit within blocks of smaller condo and student housing stock near campus. That split shows up starkly in the numbers: Zillow's automated home value estimate for Clifton runs $487,000, but the actual median sale price across 97 recent closings came in at just $301,000, a $186,000 gap and the widest disconnect between an automated estimate and a real median sale price of any pocket on this list. East Walnut Hills shows a related pattern on a smaller scale, with Gilded Age hillside Victorians near DeSales Corner on Woodburn sitting alongside more modest housing nearby, producing a $125,000 gap between the neighborhood's average and median sale price over the same trailing twelve months.
That matters at the offer table because a listing priced near a neighborhood's average could sit at the top of that market or comfortably in its middle, depending on which side of the mansion-and-condo split it falls on. Pulling the neighborhood's median alone won't tell you that. You need to know which pocket of Clifton or East Walnut Hills you're actually standing in before that number means anything.
Price tells you what a house costs. Pace and pocket tell you what it will cost to get it.
What This Means If You're Making an Offer This Fall
The practical takeaway isn't which neighborhood is "best." It's that the leverage you'll have at the table depends on where you're standing, and it's worth checking before you set expectations.
A few things worth doing before you write an offer or set a list price on the east side:
- Ask for the actual days-on-market and sale-to-list ratio for the specific pocket, not the neighborhood name broadly, since Clifton and East Walnut Hills can show very different numbers block to block.
- If you're touring a fast-moving pocket like Mount Lookout, Oakley, or Pleasant Ridge, have financing fully lined up before you tour, because these markets have been running in days rather than weeks.
- If you're touring the East End or a similarly slower pocket, build in a longer timeline for negotiation and don't assume a lower initial offer will be rejected outright.
- For sellers, price against comparable recent closings in your specific pocket rather than a neighborhood-wide average, especially in Clifton or East Walnut Hills where that average can be misleading in either direction.
A Few Questions Worth Asking
Does a faster-moving neighborhood always mean a higher price? Not necessarily. Oakley and Pleasant Ridge both move quickly and both post average sale prices well below the East End's, which sells more slowly. Pace and price are separate signals.
Is a five-week timeline in the East End a warning sign? On its own, no. It reflects the pocket's typical rhythm rather than a problem with any individual listing. It does mean a buyer there generally has more room to negotiate than a buyer competing in Mount Lookout the same week.
How do I find out which pace applies to a specific block? Recent closed sales for that exact pocket, not the wider neighborhood name, are the clearest guide. A local agent pulling those comps before you tour can save you from misjudging your position at the table.
If you're weighing a move on Cincinnati's east side, or trying to price a listing there this fall, the Woehrmyer Team can pull the block-level comps that actually apply to your search and walk you through what they mean for your offer or your list price. Book a consultation and let's look at the numbers that matter for your specific street, not just the citywide average.